
The National Occupational Licensing Database was produced by The Council of State Governments, National Conference of State Legislatures (NCSL), and the National Governors Association Center for Best Practices (NGA Center), with grant support from the United States Department of Labor, Employment and Training Administration, to contribute to the understanding of the variation in occupational licensing burdens across the country and particularly among professions for which these laws may pose unnecessary barriers to employment.
Occupations
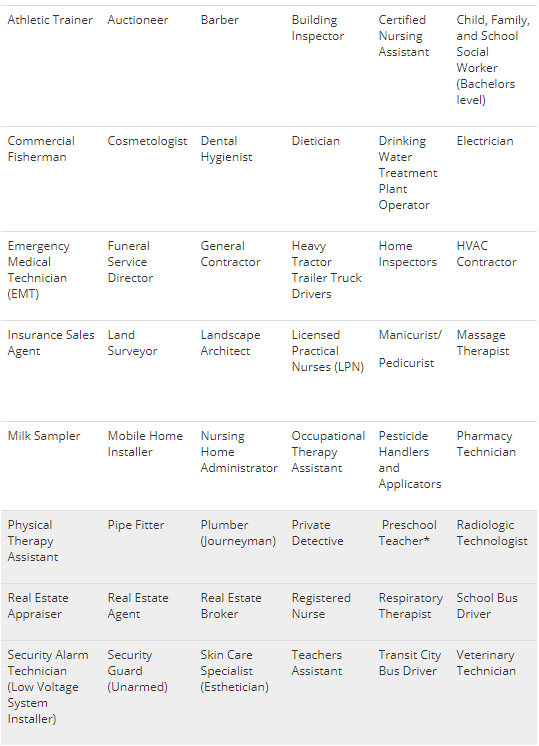
The scope of the database was narrowed from all licensed occupations in the United States to 48 identified by analysts at CSG, NCSL and the NGA Center. These 48 were chosen based on the following criteria:
-
- License required in 30 or more states.
- Licensure does not require a four-year degree education, per U.S. Bureau of Labor Statistics (BLS) education designation.
- Above zero projected growth in employment over the next 10 years, as determined by BLS.
These criteria were designed to capture professions that may be of key interest to policymakers across the country, and to provide a clear picture of the many discrepancies and variations in licensing requirements for growing professions.
Two-thirds of all jobs in the U.S. are within occupations designated by BLS as not needing post-secondary education. Further, limiting the scope of the database to only those professions that do not require four-year college degrees focuses this research on employment opportunities available to individuals without higher education, who face the highest unemployment rate in the nation. These workers are therefore more likely to encounter the undue barriers to work that policymakers may wish to address.
Lastly, not only does basing the selection of occupations on projected growth potential extend the relevancy of these data in the constantly changing labor market, it also is meant to ensure that data are provided for sectors of the economy in which discussions of workforce development may already be a focus for policymakers.
The database provides data on the occupations shown in Table 1
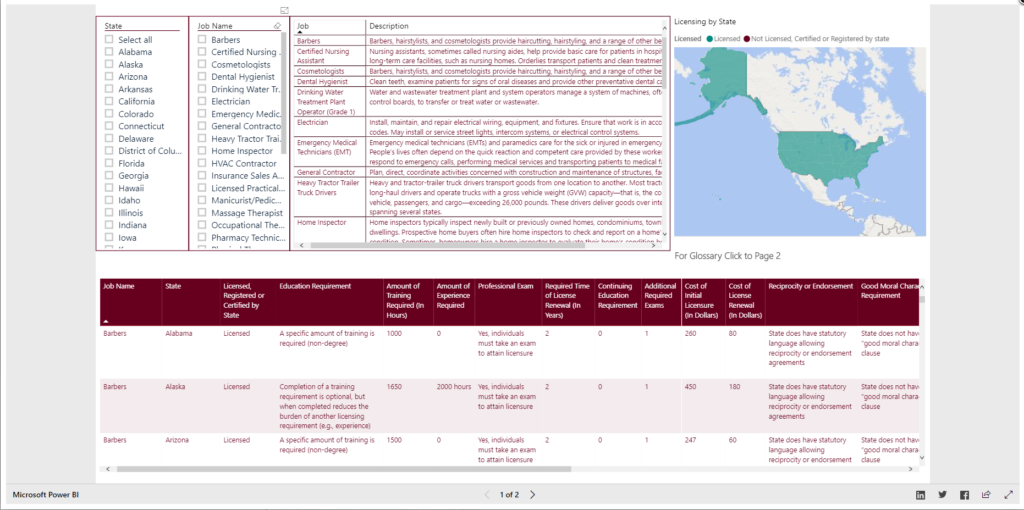
Data
For all 48 occupations, available data relating to occupational licensing laws and requirements were collected at the state level. The resulting dataset provides details on the prevalence and levels of initial and continuing education requirements, the number and frequency of examinations, amount of occupational or professional experience or other required job training and the monetary fees associated with receiving an occupational license across all states. The data is sorted by occupation and can be viewed to compare the requirements for a selected occupation across states.
For each occupation and across all states, where available, the dataset includes the following numerical variables:
-
- Level of educational attainment needed to fulfill the licensure requirement.
- Number of hours/units of training needed to fulfill the licensure requirement.
- Number of weeks of experience required to fulfill the licensure requirement.
- Number of examinations taken to fulfill licensure requirement.
- Number of years before renewal is required for an occupational license.
- Number of hours/units of continuing education required to maintain or renew licensure.
- Maximum dollar amount charged for initial licensure.
- Maximum dollar amount charged for renewal of licensure.
- Minimum age needed to fulfill licensure requirement.
Categorical variables are created to describe varying state licensing policies such as:
-
- Requirement for maintenance of “good moral character.” (Determination of moral turpitude made by licensing authority, often with broad statutory discretion)
- Restrictions imposed on individuals with criminal records (for example: blanket bans)
- Reciprocity agreements allowing interstate license recognition.
Table 2 shows the national average number of exams required, national average amount of initial licensing fees, and the proportion of states that include “good moral character” standards for the initial 34 occupations researched.
|
OCCUPATION / PROFESSION |
AVERAGE INITIAL LICENSING (IN DOLLARS) |
PERCENT OF STATES WITH “GOOD MORAL CHARACTER” REQUIREMENT |
AVERAGE NUMBER OF EXAMS |
|
Licensed practical nurse |
$301.25 |
37.3% |
1.04 |
|
Manicurist/Pedicurist |
$180.64 |
27.5% |
1.90 |
|
Massage Therapist |
$363.91 |
49.0% |
1.17 |
|
Occupational Therapy Assistant |
673.49 |
56.9% |
1.14 |
|
Pharmacy Technician |
$69.80 |
41.2% |
1.55 |
|
Physical Therapy Assistant |
$554.86 |
58.8% |
1.59 |
|
Pipefitter |
$167.87 |
7.8% |
1.09 |
|
Plumber |
$173.98 |
9.8% |
1.11 |
|
Private Detective |
$363.87 |
68.6% |
1.00 |
|
Radiologic Technologists |
$259.38 |
80.4% |
1.98 |
|
Real Estate Appraiser |
$432.58 |
98.0% |
1.04 |
|
Respiratory Therapist |
$326.27 |
33.3% |
1.00 |
|
School Bus Driver |
$96.23 |
21.6% |
1.80 |
|
Security Alarm Technician |
$214.27 |
17.6% |
1.06 |
|
Security Guard |
$120.88 |
45.1% |
1.00 |
|
Esthetician |
$175.24 |
27.5% |
1.92 |
|
City Bus Driver |
$52.42 |
37.3% |
2.04 |
|
Veterinary Technician |
$400.28 |
39.2% |
1.51 |
|
Dental Hygenist |
$1,600.67 |
64.7% |
2.61 |
|
Water Treatment Plant Operator |
$176.07 |
2.0% |
1.00 |
|
Electrician |
$137.34 |
0.0% |
1.00 |
|
Emergency Medical Technician |
$121.40 |
47.1% |
1.94 |
|
General Contractor |
$355.97 |
25.5% |
2.05 |
|
Tractor Trailer Truck Driver |
$49.16 |
3.9% |
2.04 |
|
Home Inspector |
$468.34 |
21.6% |
1.18 |
|
HVAC Contractor |
$332.34 |
9.8% |
1.39 |
|
Insurance Sales Agent |
$86.02 |
0.0% |
1.00 |
Data were collected by staff at CSG, NCSL, and the NGA Center though a review of state code and statute from July-September 2017. The data then underwent a comprehensive cleaning process to ensure accuracy and reliability across each of the 34 occupations and all 50 states and the District of Columbia.
Database Addendum: Teacher Licensure (link)
To better capture the elements of the 51 separate sets of requirements for teacher licensure (50 states and the District of Columbia), The Council of State Governments has developed a database identifying the requirements each state has for teacher certification. Gathering this scattered data into a single database eliminates much of the confusion around differing state requirements and makes direct licensure comparisons among states and the District – such as the state a licensed teacher moves from and the state they will move to, for example – much easier.
These workforce products were funded by a grant awarded by the U.S. Department of Labor’s Employment and Training Administration. These products were created by the recipients and do not necessarily reflect the official position of the U.S. Department of Labor. The Department of Labor makes no guarantees, warranties, or assurances of any kind, express or implied, with respect to such information, including any information on linked sites and including, but not limited to, accuracy of the information or its completeness, timeliness, usefulness, adequacy, continued availability, or ownership. This product is copyrighted by the institutions that created them.